Fig. 2

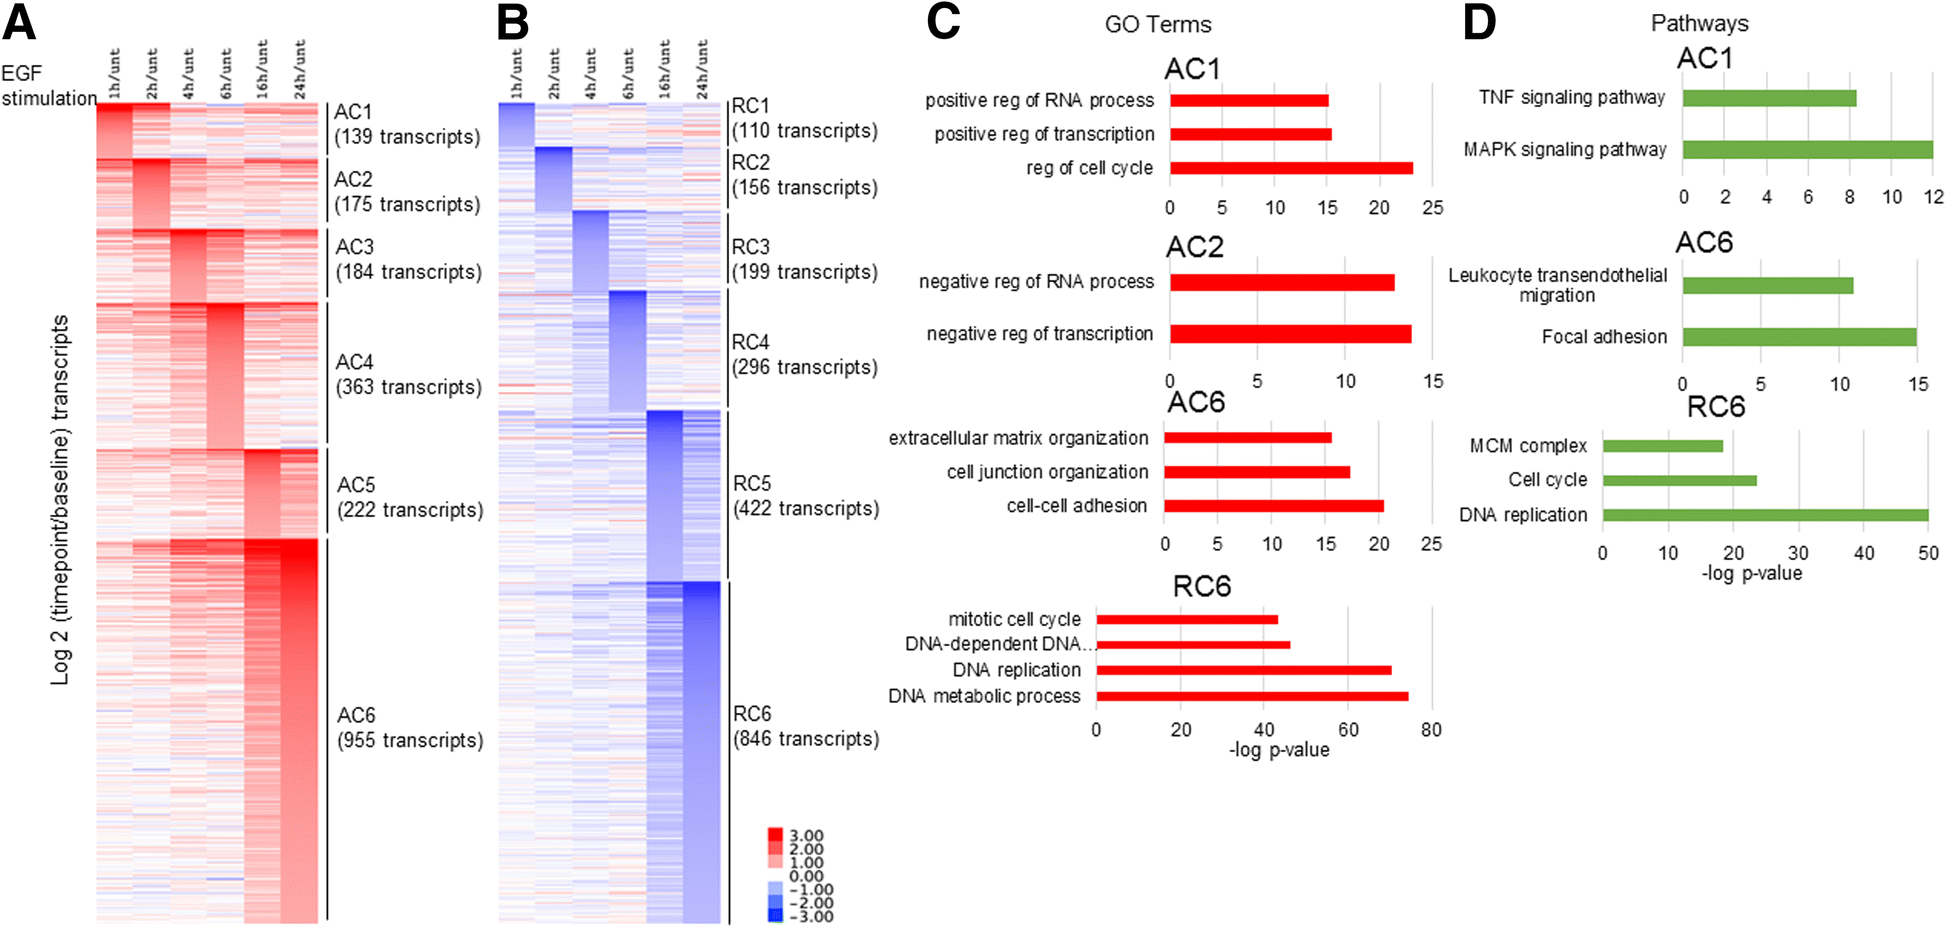
EGF RNA-seq time course and GO terms. a EGF was added for indicated times in serum starved SKBR3 cells. RNA-seq was conducted. Fragments Per Kilobase of transcript per Million mapped reads (FPKM) values were generated using Cufflinks. And transcripts whose expression was induced or b repressed to at least twice (in biological replicates) the baseline level were graphed according to when they reached their peak or summit in expression AC = activated cluster RC = repressed cluster. Only FPKM values of greater than 0.5 were kept. The number of each transcript in each cluster is indicated in parenthesis. c Gene ontology (GO) terms and d KEGG Pathways as reported by HOMER