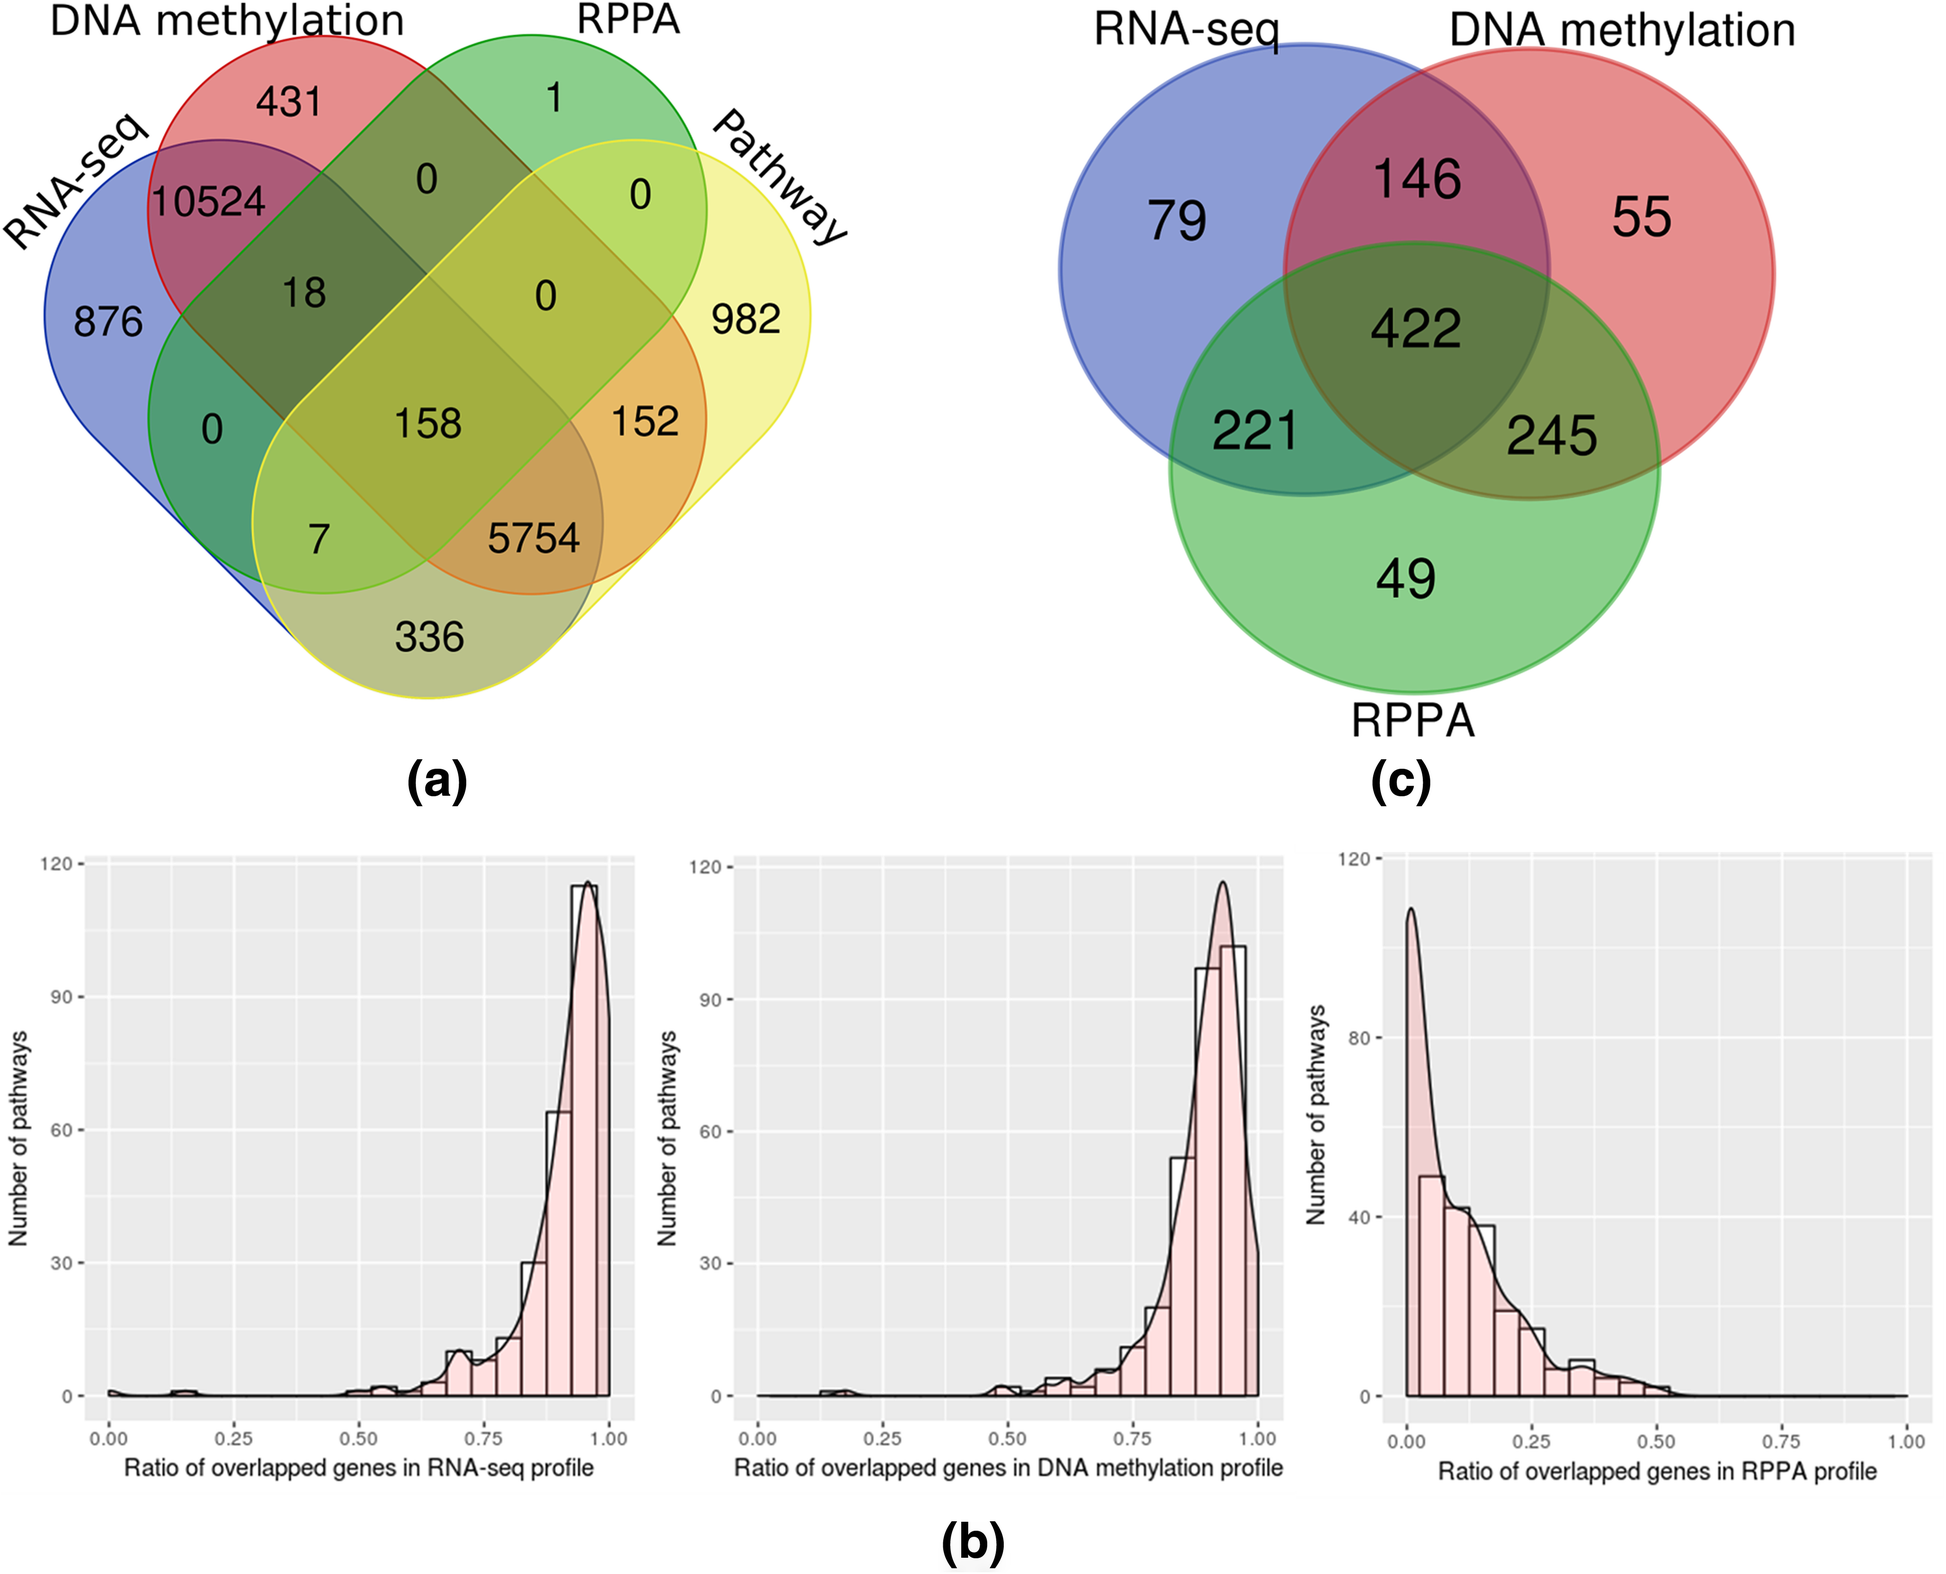
Fig. 1

Distribution of RNA-Seq, DNA methylation, RPPA profile, and KEGG pathway data. (a). Venn diagram for genes (or proteins) in RNA-Seq, DNA methylation, RPPA profile, and KEGG pathway. Venn diagram for showing the distribution of logical relation among genes (or proteins) in each profile (Venn diagram was drawn using a tool in this website - http://bioinformatics.psb.ugent.be/webtools/Venn/). (b). Distribution of the ratio of overlapping genes (or proteins) with those genes in each pathway. The frequency over the ratio of overlapping genes (or proteins) in each omics profile with genes in each pathway is shown as histogram and density plot. (c). Venn diagram for the number of samples in each omics profile